Actionable Analytics
for Compliance
Key metrics, risks, and trends at a glance.
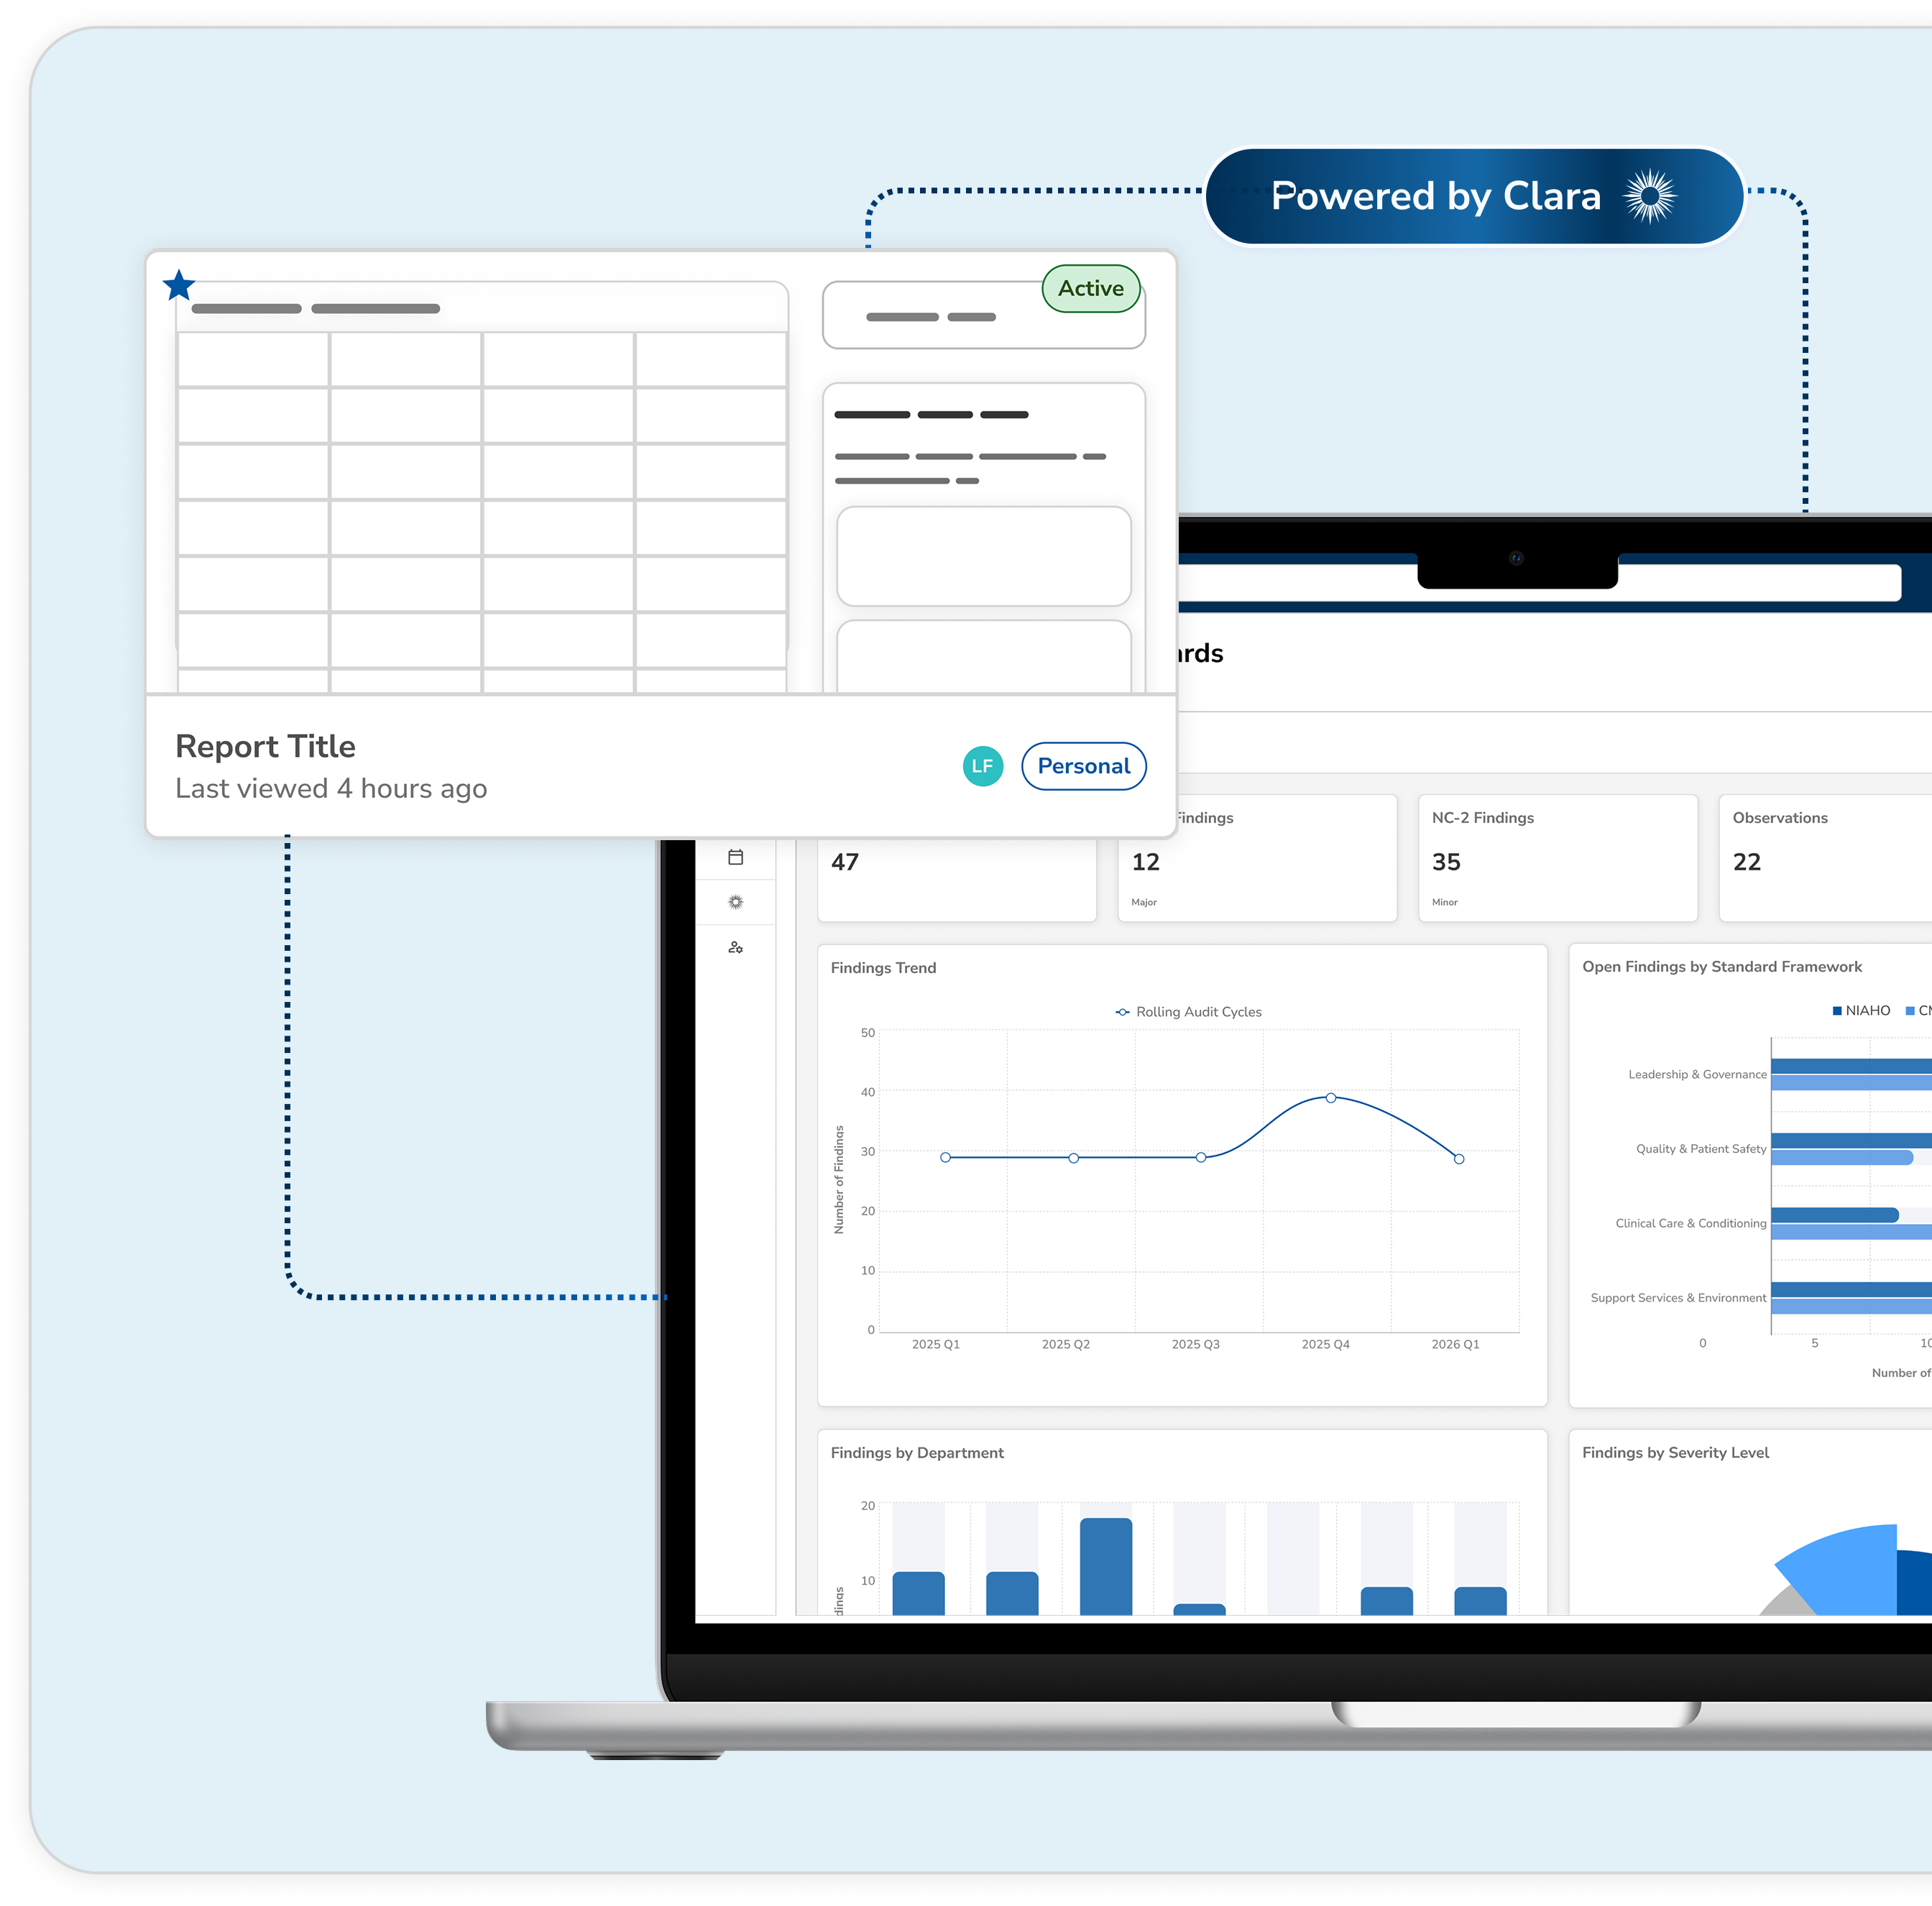
- Instant visibility into audit results and risk patterns.
- Templates designed specifically for healthcare compliance.
- Customize charts and reports instantly.
- No BI experience needed.
Smarter Insights Tailored for Hospitals

For Healthcare Compliance
Relevance BI is tailored specifically for hospitals and healthcare standards, not generic BI tools. It organizes data around audits, findings, and risk categories so insights are immediately actionable.

Pre-Built Dashboards
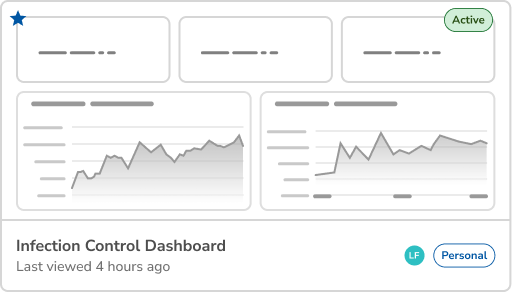
Access ready-made dashboards aligned with DNV, CMS, and NIAHO standards, designed to save time and reduce setup complexity. These templates help your team track compliance without starting from scratch.
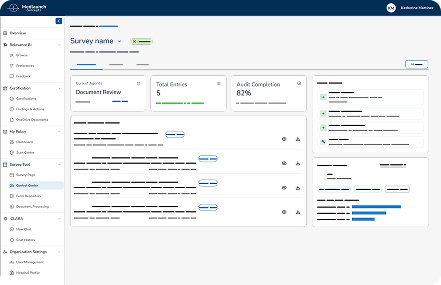

Real-Time Monitoring
Track audits, findings, and corrective actions as they happen, ensuring your team never misses critical risks. Alerts and visual dashboards provide instant visibility across departments.
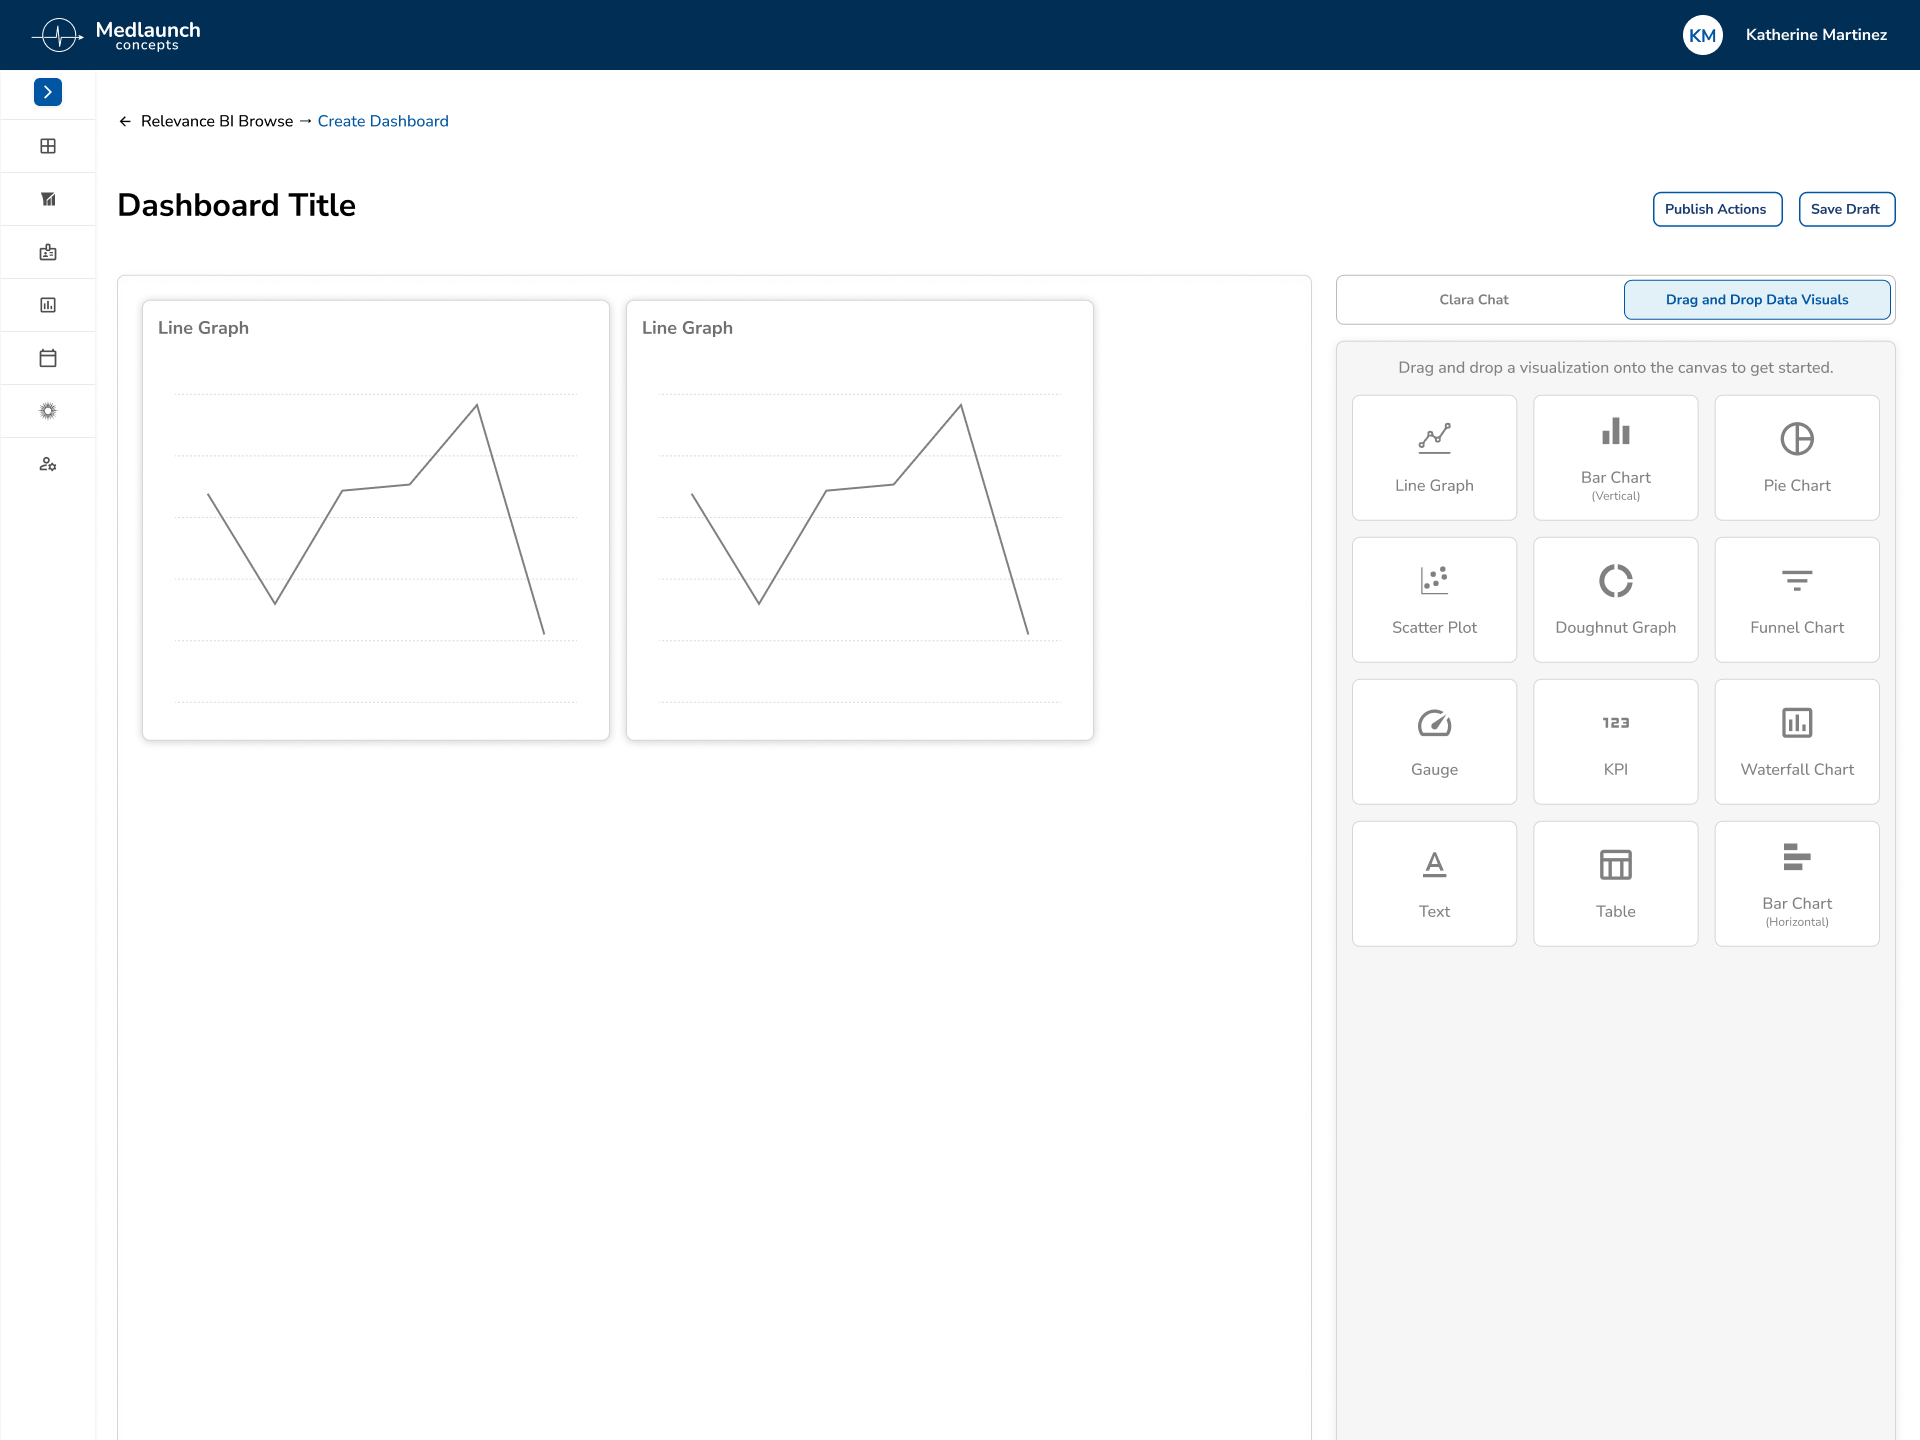

Custom Visualizations
Easily create charts, graphs, and dashboards tailored to your hospital's needs, no BI expertise required. Turn raw data into meaningful visuals that drive decisions and showcase results, or use Clara AI for extra assistance.
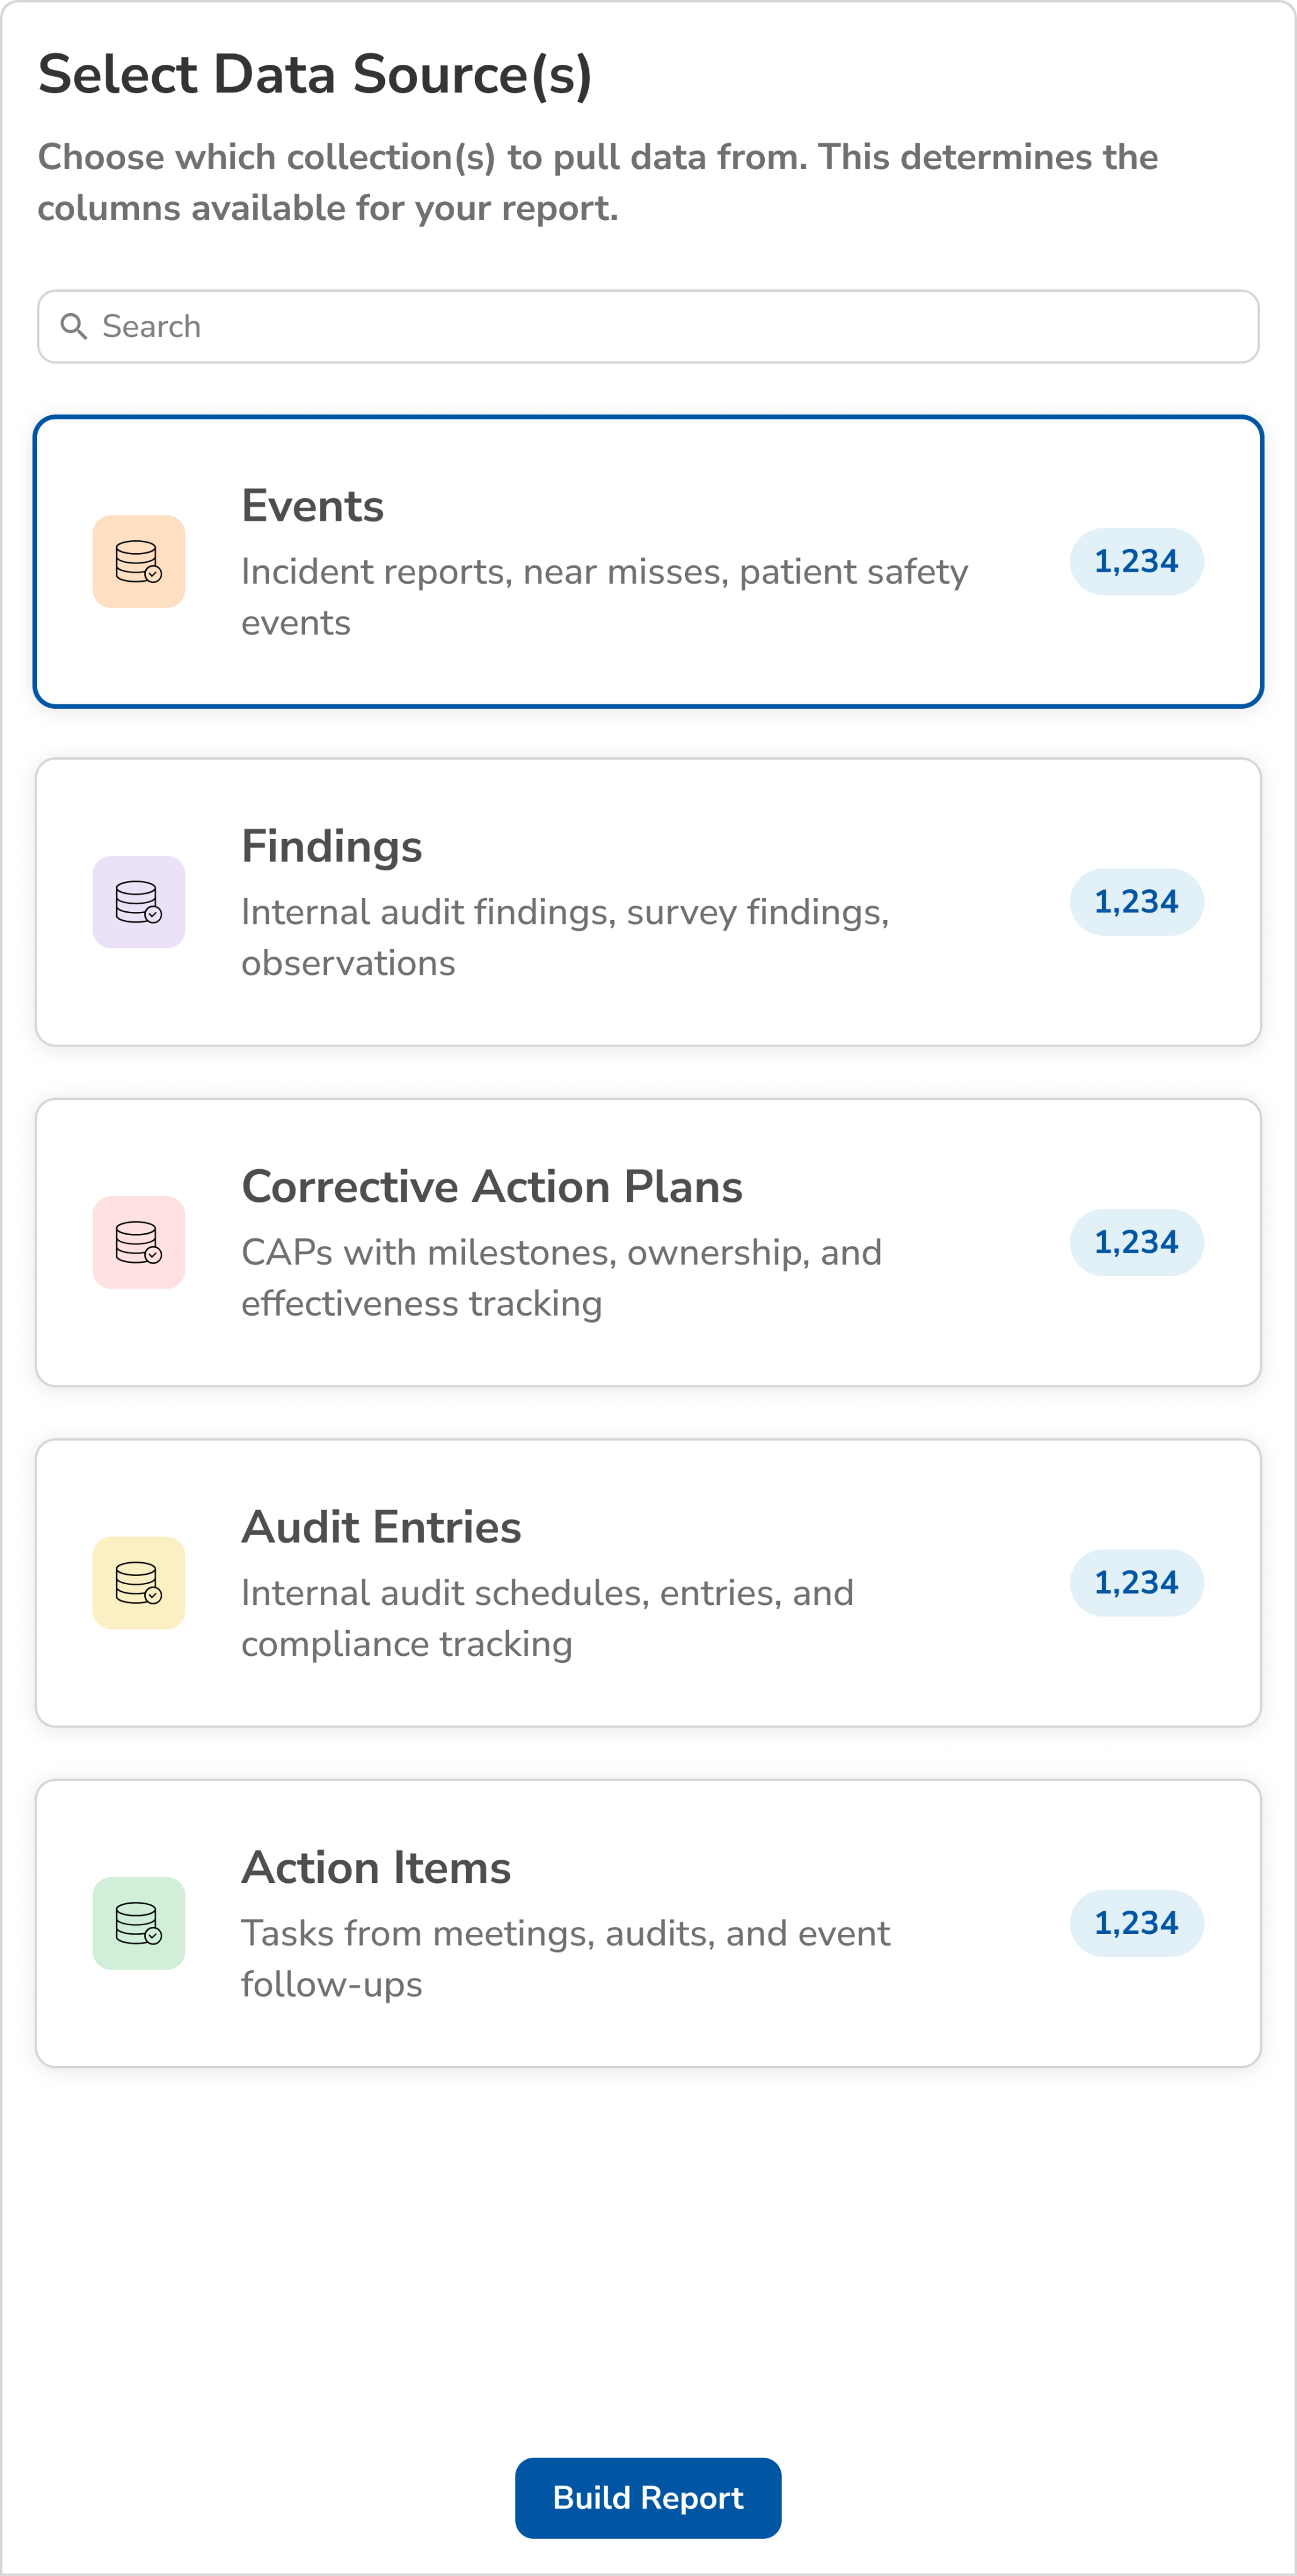
No Data Source Selected
Select a data source in the Report Builder to preview your Excel export, or use Clara Chat to describe what you need.
Turn raw data into structured, report-ready insights. Upload your file, preview and validate key fields, and generate consistent, audit-ready reports with confidence.
- Fetch data application-wide
- Auto-populate with Clara
- Tailored smart suggestions & recommendations
- Manually edit with ease
- Preview & export for full circle cycles
Relevance BI pairs with Clara. Tell her what you want to see and she builds the visual.
- Ask"Bar graph of last quarter's top 10 risks"
- Ask"Trend of overdue findings by department"
- Refine"Clara, make the graph horizontal", or drag and drop to edit it yourself
Try asking Clara:
Type a request in plain language and Clara builds the chart, table, or dashboard.
Hospital Overview
Create a bar chart showing sales data by region
Data Table
Add a table displaying top 10 threats and/or risk areas
Trend Analysis
Show me a line chart of recurrence trends over the last 6 months
Distribution Chart
Create a pie chart breaking down CAP by category
Generate Report
Generate report on patient compliance by department
Compliance Dashboard
Create a dashboard of compliance metrics across all departments
Patient Feedback Analysis
Analyze patient feedback for improvement opportunities
Monthly Compliance Trends
Visualize monthly trends in compliance rates over the past year
Audit Results Summary
Summarize results from recent audits for review
Ask for the view.
Clara builds it.
Clara turns a plain-language request into live dashboards and reports policy status, survey readiness, and compliance trends so teams see where attention is needed.
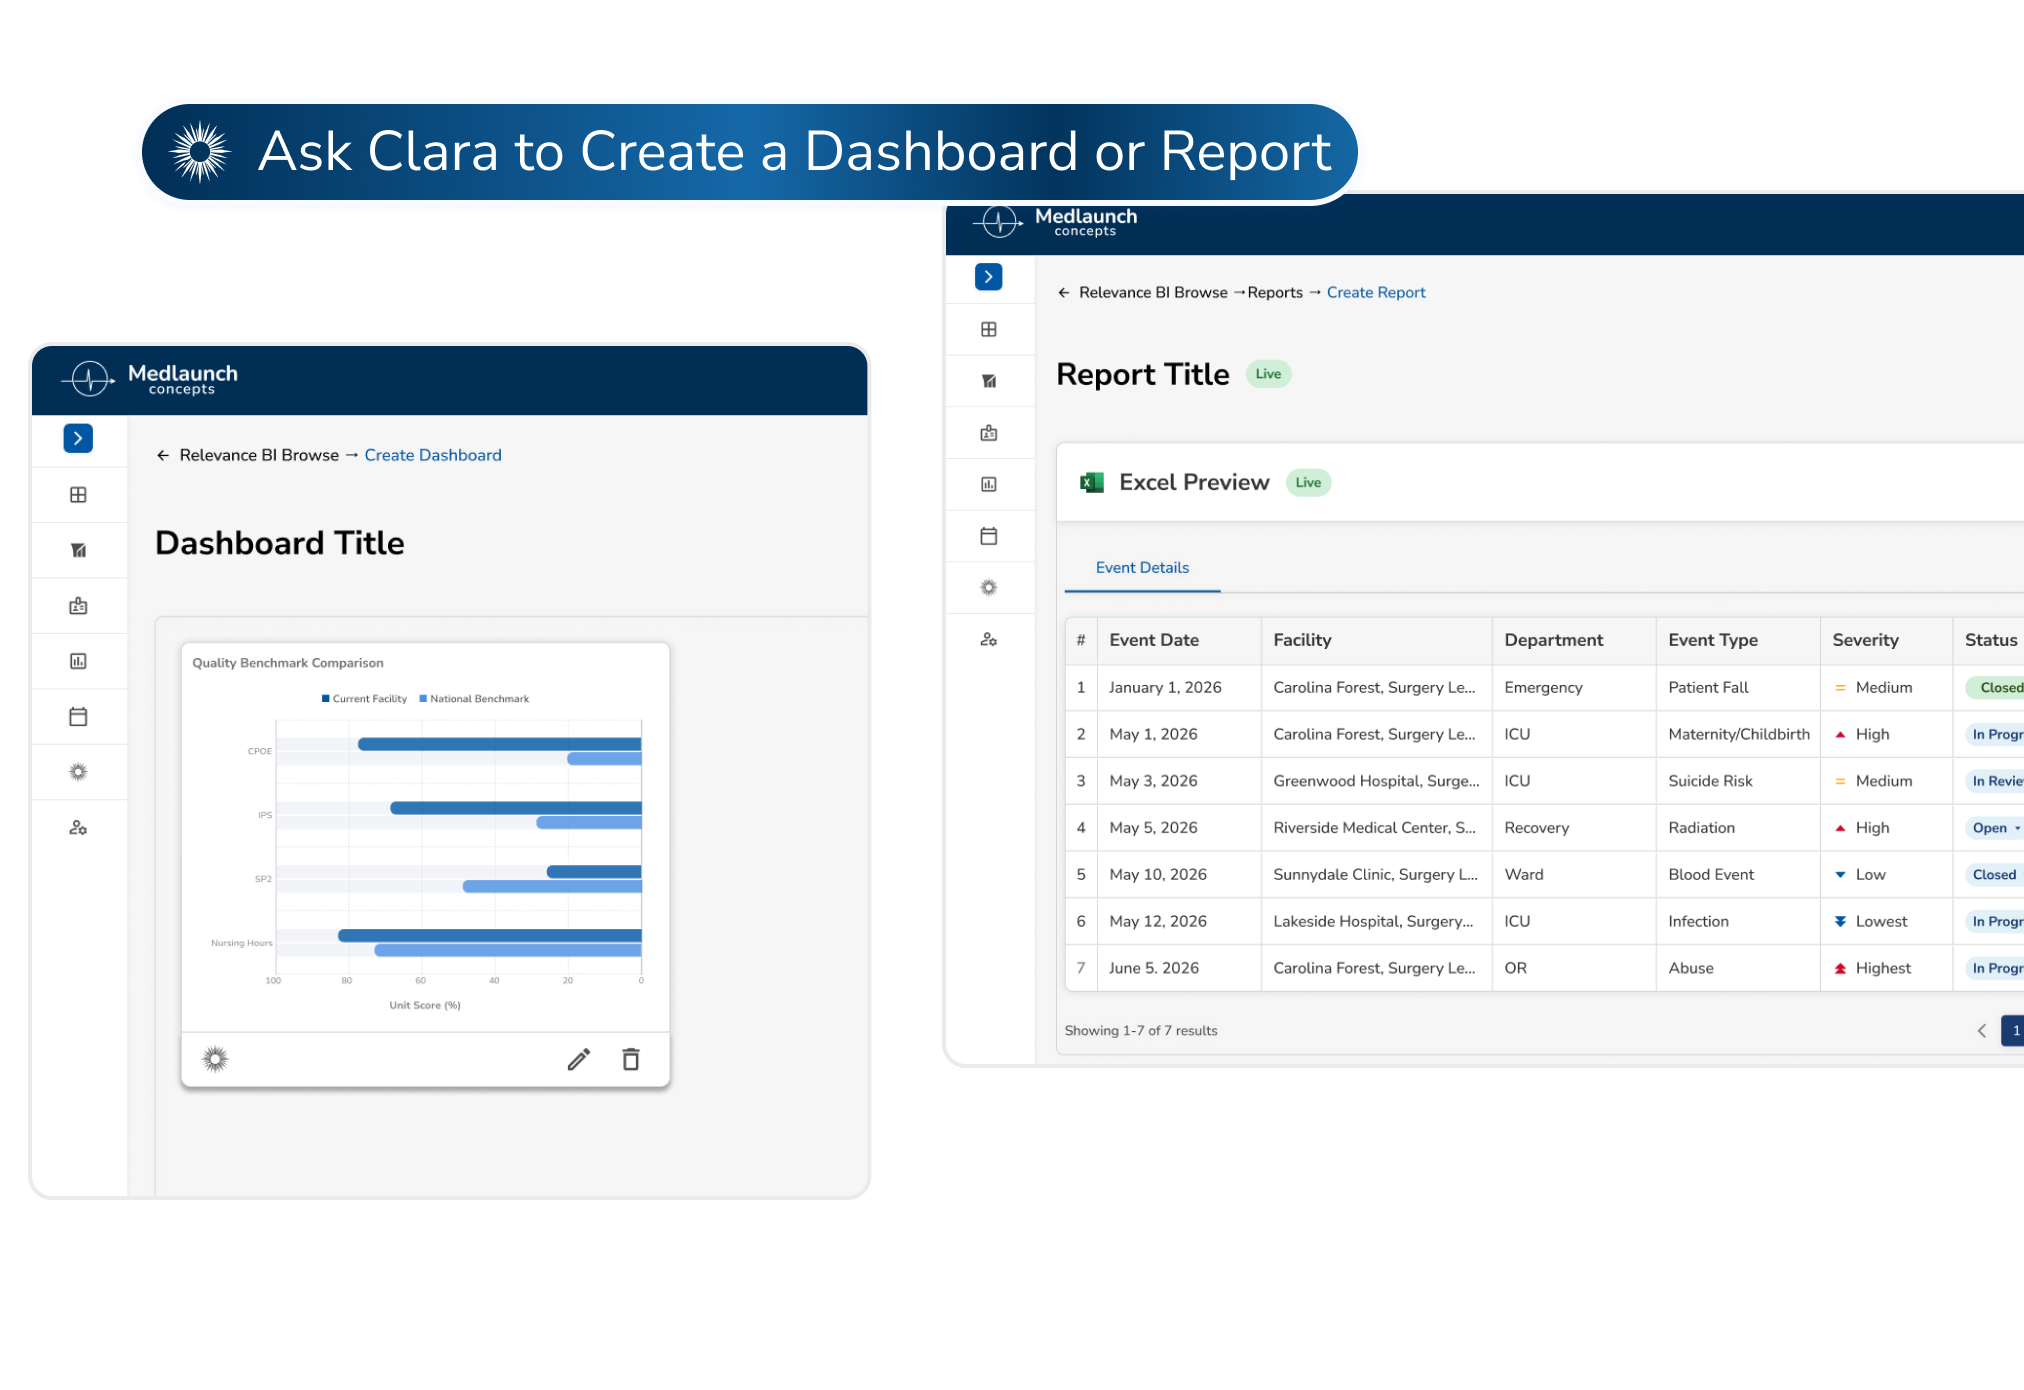
What's Possible with Relevance BI
Reporting, benchmarking and the model underneath them
See Relevance BI In Action
Book a demo today and discover how Relevance BI can turn your hospital's compliance data into clear, actionable insights. In minutes, you'll see how Clara AI and Relevance BI together make reporting faster, easier, and smarter.