Ask for the View. Clara Builds It.
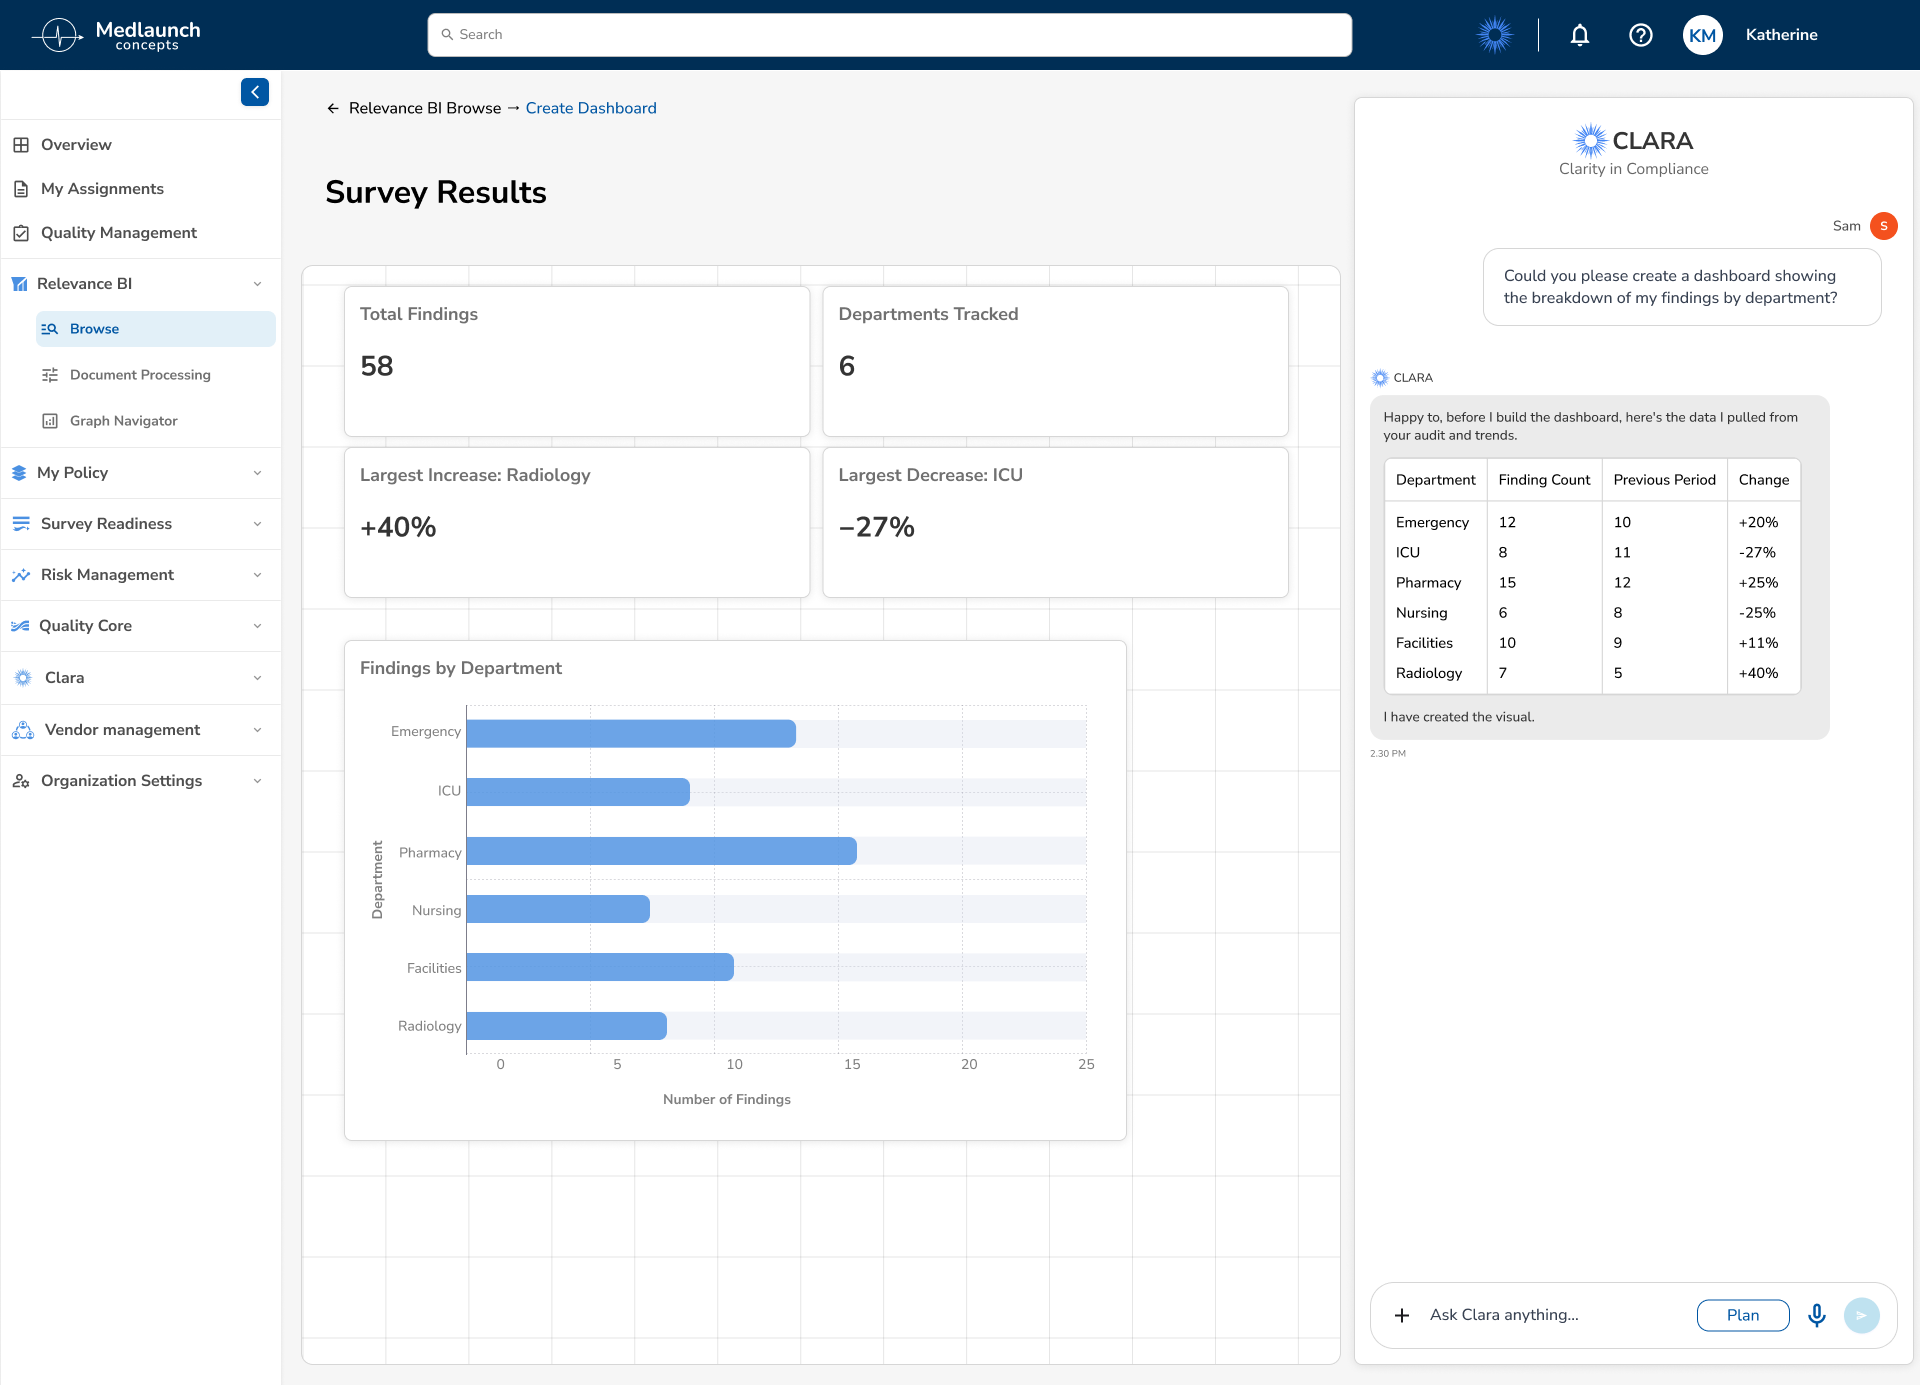
You know what you want to see. You just don't want to build it. Describe the view, "trend of overdue findings by department", and Clara assembles the dashboard, then changes it when you tell her to. You keep every edit.

From a Sentence to a Dashboard
You ask
It's Monday. The question in your head is "trend of overdue findings by department." You say it, or you type it. You do not open a builder, choose an aggregation, or file a ticket with anyone.
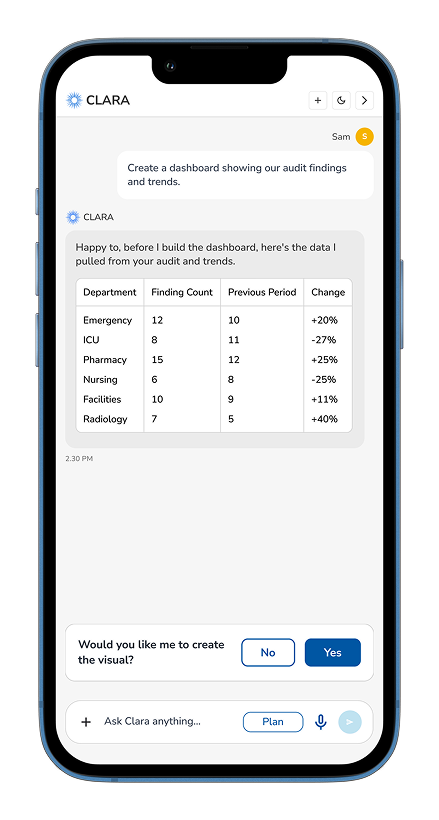
Clara builds
The chart appears, the right shape for the question, drawn from live platform data. It is a real dashboard widget, not a picture: you can open its configuration and see every field and filter Clara chose.
Related
The chart is not the point. The point is that you asked for it out loud and it exists.
We Don't Predict Your Future. We Show You Other People's Past.
Forecasting, Carefully
What Similar Hospitals Actually Did
Ask whether a target is realistic and the answer comes from history, not from a projection about you. Relevance BI matches your facility profile, bed size, teaching status, ownership, region, accreditor, against years of public performance data and reports what share of hospitals like yours reached that target, and in how long.
Trend, Not Prophecy
Fit a linear trend or a moving average to a series you already have and see the direction under the noise. It is arithmetic on your own data, computed on the chart in front of you, which is why it is trustworthy and why it is not a forecast.
Is This Target Realistic?
Before your quality plan commits to a number, check how often hospitals with your profile have reached it, over what horizon, and how many hospitals were in the comparison. A target nobody like you has ever hit is worth knowing about in advance.
Recurrence as an Early Signal
The most useful predictive signal in quality is not a model; it is that this finding has happened before, in this department, after a CAP that was already closed once. Recurrence is tracked as a first-class measure, by facility, department, standard and CAP owner.
See RecurrenceWhat We Don't Claim
We will not tell you what your next survey will find. The data has a lag measured in months, and a confident number about your future would be a guess with a decimal point on it. What we will tell you is what has already happened, to you and to hospitals like you.
Related
How Clara AI Enhances
Your Dashboards
Need to know what a chart is telling you? Just describe what you're looking at. Clara will read the view, name what changed, and point at the records underneath, then stop, because deciding what to do about it is your job, not hers. A co-pilot, not an autopilot.

CLARA
Clarity in complianceClara reads
Clara proposes
Every field and filter Clara chose stays visible and editable, and the records behind a reading are one click away.
Related
Trend lines and moving averages are statistics computed on the chart in front of you, not AI.